
Atsora Machine Monitoring Platform
Advanced monitoring for CNC shops.
Atsora is the machine monitoring platform we use to help manufacturers uncover hidden capacity and run more predictable operations.
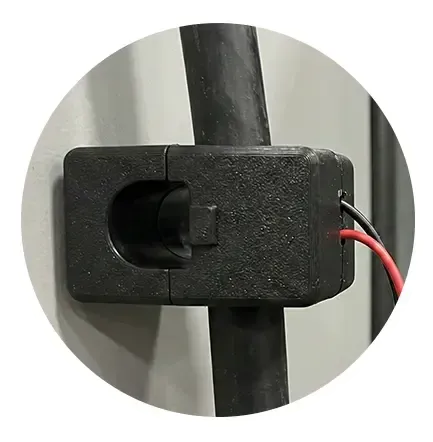
It connects directly to CNC machine controls -across all brands, ages, and control types - to capture accurate, real-time production data without clamp-on sensors or manual entry.
OUR PROTOCOLS
Easy, safe, and hassle-free.
What Atsora Replaces
Many manufacturers have some form of monitoring, but it falls short:
Clamp-on sensors that guess machine states instead of knowing them Manual data input that's error-prone and operator-dependent Single-brand systems that don't scale across mixed-machine shops Dashboards that show activity but don't include performance or explain why problems occur
Atsora closes these gaps with direct control-level data.

Why Clamp-On Monitoring Falls Short in Production Environments
They struggle with:
- Differentiating setup, production, and maintenance states
- Capturing feed rate and speed override changes
- Detecting tool-related issues before they cause problems
- Supporting unattended machining environments effectively
Feed rates and feed overrides
Tool life and usage tracking
Cycle start, stop, and completion events
Spindle load in real-time
Operation and part identification
Machine alarms and fault conditions
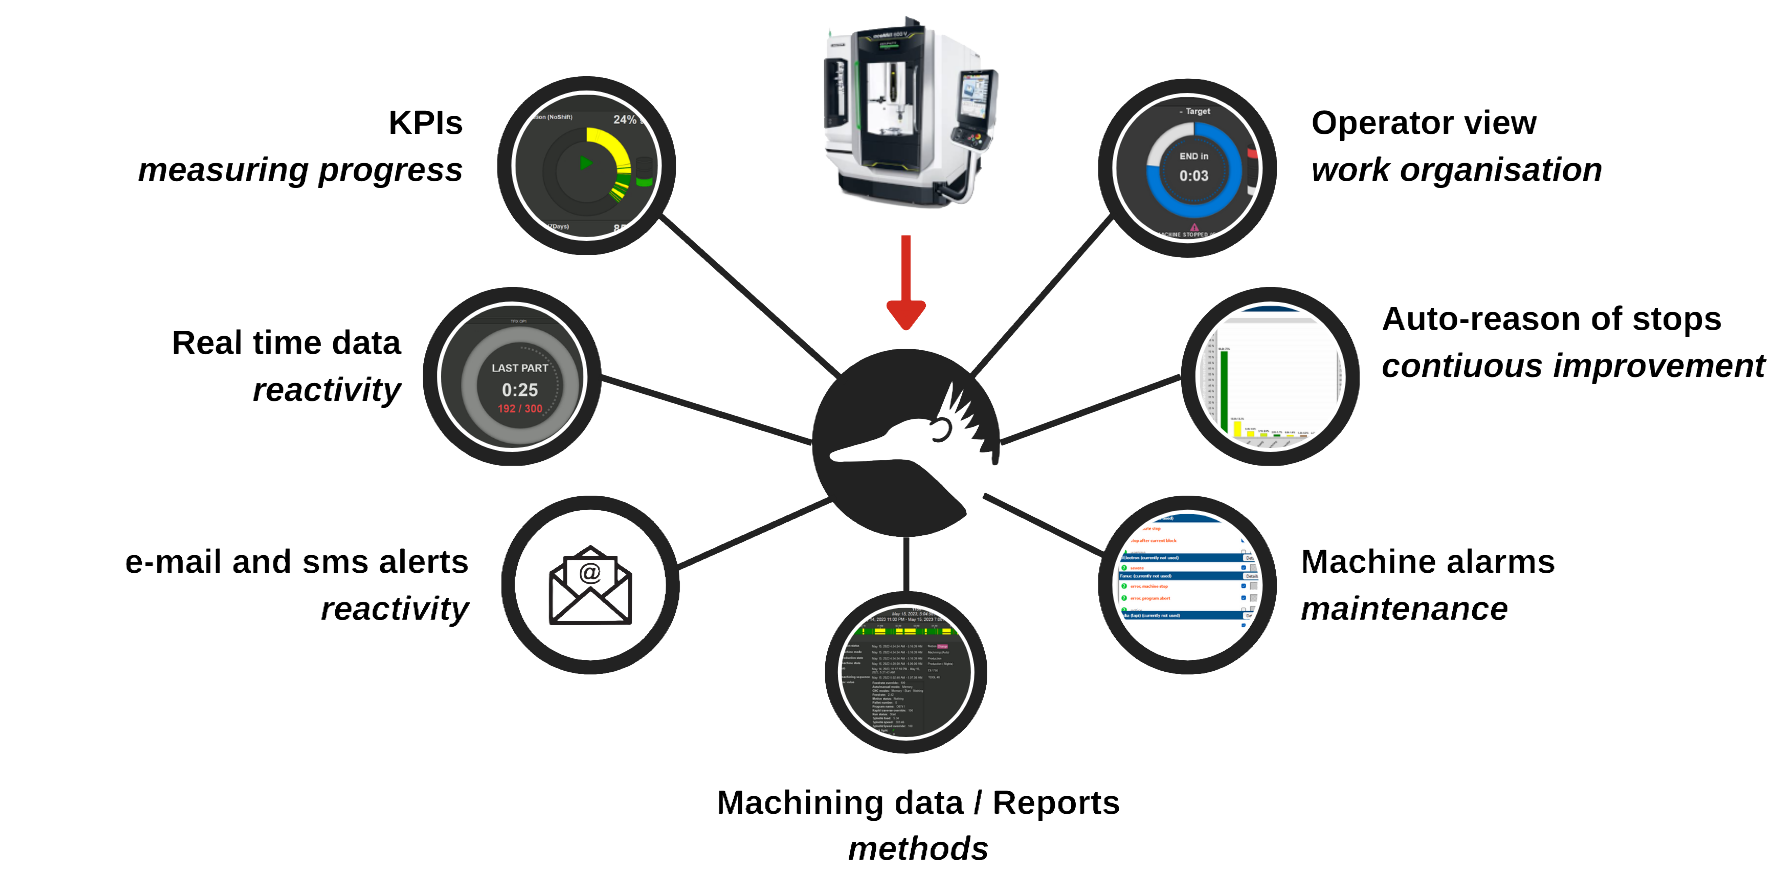
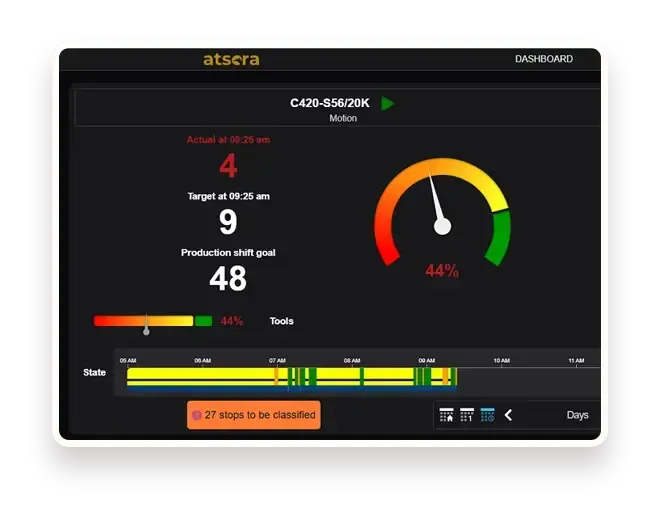
Atsora reads directly from CNC controls to capture the signals that explain performance:
Accurate Utilization Metrics You Can Trust
OEE
(Overall Equipment Effectiveness)
Availability × Performance × Quality based on planned production
OOE
(Overall Operations Effectiveness)
Accounts for scheduled vs. unscheduled production time
TEEP
(Total Effective Equipment Performance)
True utilization including all available time
Key Features That Drive Results
Automatic Downtime Detection
Part Count & Cycle Tracking
Machine State Templates
Energy Consumption Monitoring
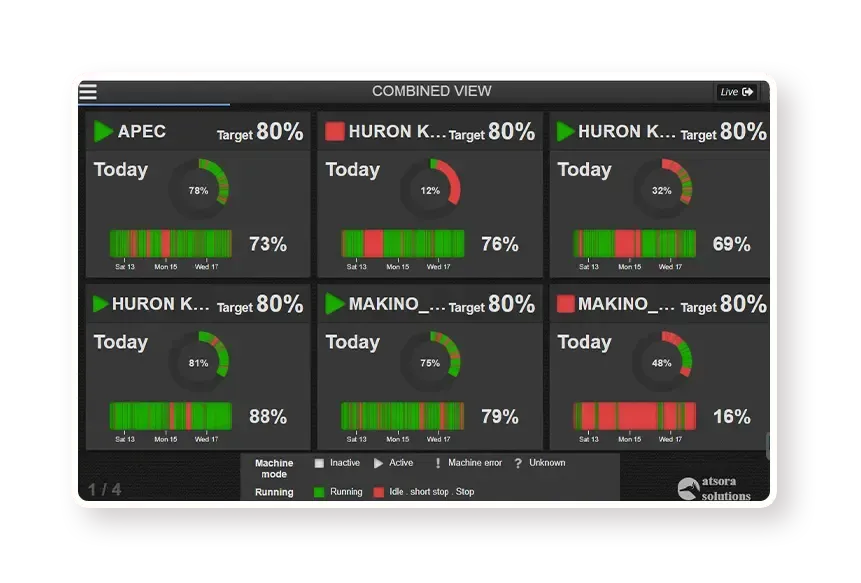
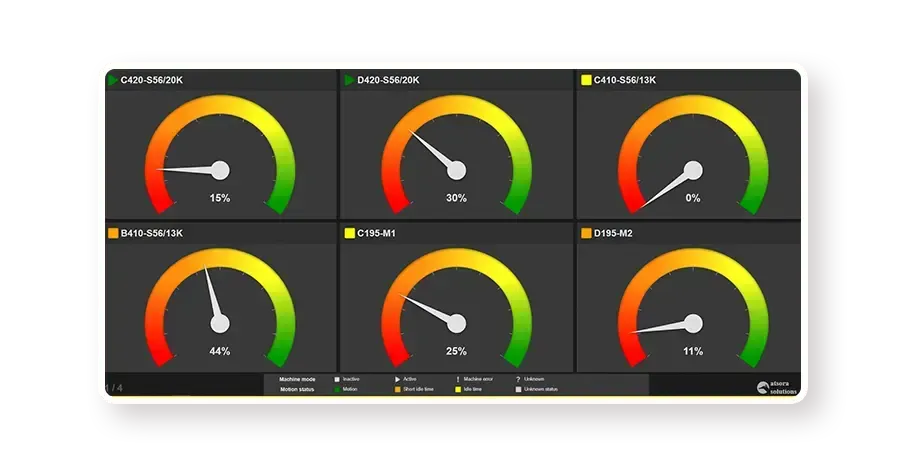
Live Shop-Floor Displays
Integration Ready
Platform + Consulting = Real Results
Atsora delivers accurate data. IIOT Consulting turns that data into improvement.
We stay involved to...
Configure machine states to match your actual planned production periods
Analyze trends and identify high-impact opportunities
Work with your operators and supervisors
Turn reports into clear, actionable decisions
Software alone doesn't deliver ROI. That's why we're different.